Listen to interview here

Listen to interview here

Hear the interview here


Hear the interview

This article first appeared on Planetizen at www.planetizen.com
Useable data of the effects of ride-hailing service on travel behavior is sorely lacking, but a new study sheds light on critical questions about what companies like Uber and Lyft mean for transit, active transportation, and congestion.
A new report on the adoption and use of ride-hailing finds that services like Uber and Lyft attract passengers away from public transit, biking, and walking, in addition to serving as a complementary mode (e.g., for commuter rail). The UC Davis Institute of Transportation Studies research is the first-ever study with representative data from major cities across America on ride-hailing and its impact on travel decisions.
Ride-hailing services like Uber and Lyft are clearly shaping the way that people move in major cities. However, due to their rapid rise in popularity, the relatively slow pace of regulation, and lack of available data on how, when, and why people use these services, city planners and transportation researchers have been limited in their ability to provide insights into how ride-hailing is changing travel choices and plan for the future. The downside is that those who are responsible for making important long-range decisions about transportation infrastructure and vehicle fleets (e.g., auto manufacturers) are essentially operating in the blind without data.
The new report was produced by researchers at the University of California, Davis Institute of Transportation Studies — one of five leading national transportation research centers funded by the U.S. Department of Transportation.
Uber and Lyft most likely add to traffic in major cities today
In this study based on data collected in major cities across America, we found that a large portion of travelers are substituting ride-hailing in place of public transit, biking, and walking trips, or would not have made the trips at all (Fig. 1). These trips, which are being substituted for or generated by ride-hailing, are most likely adding vehicles to the road in major metropolitan areas. There is a significant need for future research on the topic — the most recent findings from major cities seem to suggest that ride-hailing is likely adding to, not reducing traffic congestion.
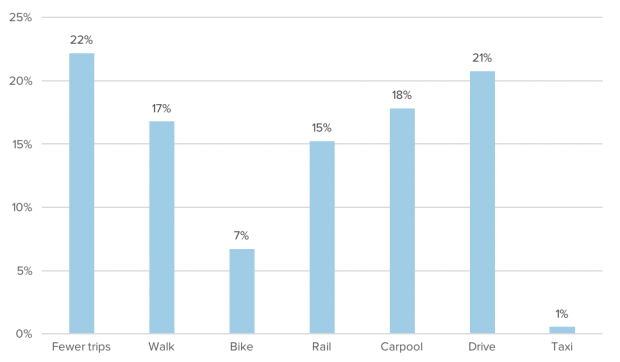
Figure 1. How ride-hailing users would travel if Uber or Lyft were unavailable.
The research (and ride-hailing firms themselves) suggest that ride-hailing can be complementary to public transit. This is also true. However, this study finds that while some portion of individuals increase their transit use (an increase in commuter rail use), the net effect across the entire population is an overall reduction in public transit use and a shift towards lower occupancy vehicles (i.e. more cars).
The broader implications of this shift in travel choice are critical. Cities are grappling with how to plan for the potential introduction of autonomous vehicles, which many believe will be deployed through shared services, not to mention the ever-rising impacts of the transportation sector on energy use and emissions. As of 2016, transportation surpassed the power sector as the largest contributor to the U.S. climate problem.
Many believe that sharing vehicles can help address our growing transportation woes — however, this research shows that sharing vehicles is not enough. We will likely need to foster more dense development patterns that can minimize vehicle miles traveled through walkable and bike-friendly neighborhoods, continue to invest in mass transit, and facilitate shared rides in shared vehicles through pricing or incentives.
With the right model, it is also possible that ride-hailing could serve as an effective solution in existing suburban areas where personal vehicles dominate travel. However, without significant coordination between cities, public transit agencies, and ride-hailing services themselves, we do not believe this optimistic scenario is likely to materialize. It hasn’t thus far.
Evolution of shared mobility services
Much of prior academic research on impacts of shared mobility services study what we term carsharing 1.0 — that is, early models of carsharing where vehicles were picked up and returned to the same location, typically through hourly rentals (Fig. 2). A key takeaway from this recent report is that not all shared services can be viewed as the same.
The adoption rates of ride-hailing far outpace the adoption rates of prior carsharing models. Older business models of carsharing have attracted only 2 million members in North America and close to 5 million globally — over roughly 15 years. Conversely, the adoption ride-hailing (e.g., Uber, Lyft, Didi), the latest model of “shared mobility” is estimated to have grown to more than 250 million users globally within their first five years of existence.
Prior research shows that carsharing members (e.g. Zipcar, car2go) were highly educated and environmentally oriented. We believe that the widely cited vehicle reduction “impacts” of carsharing were more likely due to self-selection bias rather than a significant causal relationship. Early carshare members were motivated to reduce their environmental footprint, and they represent less than 1% of the entire U.S. population.
Ride-hailing, on the other hand, has captured a much broader swath of the population. Interestingly, but perhaps not surprisingly, we find that more than half of carsharing users surveyed dropped their membership, with 23% citing their use of services like Uber and Lyft as the top reason they no longer use carsharing.
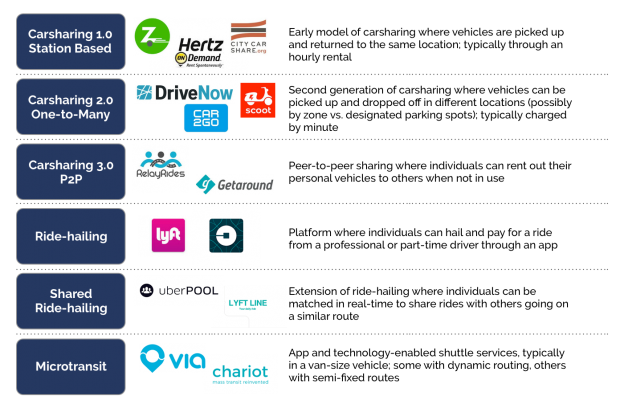
Figure 2. The evolution of shared mobility services.
Reduced vehicle ownership and reduced carsharing membership
The research study reveals a number of additional insights into the travel decisions made by individuals and households, including the demographics of typical ride-hailing adopters, frequency of ride-hailing use, and vehicle ownership decisions.
Key findings include the following:
Nearly a quarter (24%) of ride-hailing adopters in metropolitan areas use ride-hailing on a weekly or daily basis.
Parking represents the top reason that urban ride-hailing users substitute a ride-hailing service in place of driving themselves (37%).
College-educated, affluent Americans have adopted ride-hailing services at double the rate of less educated, lower income populations.
Among adopters of prior carsharing services, 65% have also used ride-hailing. More than half of them have dropped their membership, and 23% cite their use of ride-hailing services as the top reason they have dropped carsharing.
Ride-hailing users have higher personal vehicle ownership rates than those who use “transit only”: 52% versus 46%.
Among non-transit users, there are no differences in vehicle ownership rates between ride-hailing users and traditionally car-centric households.
Those who have reduced the number of cars they own and the average number of miles they drive personally have substituted those trips with increased ride-hailing use. Net vehicle miles traveled (VMT) changes are unknown.
After using ride-hailing, the average net change in transit use is a 6% reduction among Americans in major cities.
As compared with previous studies that have suggested shared mobility services complement transit services, the substitutive versus complementary nature of ride-hailing varies greatly based on the type of transit service in question. On average, ride-hailing hailing appears to reduce bus ridership and complement commuter rail.
49% to 61% of ride-hailing trips would have not been made at all, or by walking, biking, or transit.
Directionally, based on mode substitution and ride-hailing frequency of use data, ride-hailing is currently likely to contribute to growth in vehicle miles traveled (VMT) in the major cities represented in this study.
The full report can be downloaded through the ITS website.
Regina Clewlow, PhD is a leading transportation researcher on shared mobility and autonomous vehicles. She received her Ph.D. from MIT in Transportation Systems, and has served as a research scientist at UC Berkeley, Stanford, and UC Davis. Dr. Clewlow joined the transportation startup world where she was previously the Director of Business Development and Strategy at Ridescout (acquired by Daimler and rebranded as moovel). To learn more about how to access new urban mobility insights sign up here, or contact her via LinkedIn.

The recent emergence of natural gas as an abundant, inexpensive fuel in the United States could prompt a momentous shift in the level of natural gas utilized in the transportation sector. The cost advantage of natural gas vis-à-vis diesel fuel is particularly appealing for vehicles with a high intensity of travel and thus fuel use. Natural gas is already a popular fuel for municipal and fleet vehicles such as transit buses and taxis. In this paper, we investigate the possibility that natural gas could be utilized to provide fuel cost savings, geographic supply diversity and environmental benefits for the heavy-duty trucking sector and whether it can enable a transition to lower carbon transport fuels. We find that a small, cost-effective intervention in markets could support a transition to a commercially sustainable natural gas heavy-duty fueling system in the state of California and that this could also advance some of the state’s air quality goals. Our research shows that an initial advanced natural gas fueling system in California could facilitate the expansion to other U.S. states. Such a network would enable a faster transition to renewable natural gas or biogas and waste-to-energy pathways. Stricter efficiency standards for natural gas Class 8 trucks and regulation of methane leakage along the natural gas supply chain would be necessary for natural gas to contribute substantially to California’s climate goals as a trucking fuel. To date, industry has favored less expensive technologies that do not offer the highest level of environmental performance.
By: Lew Fulton
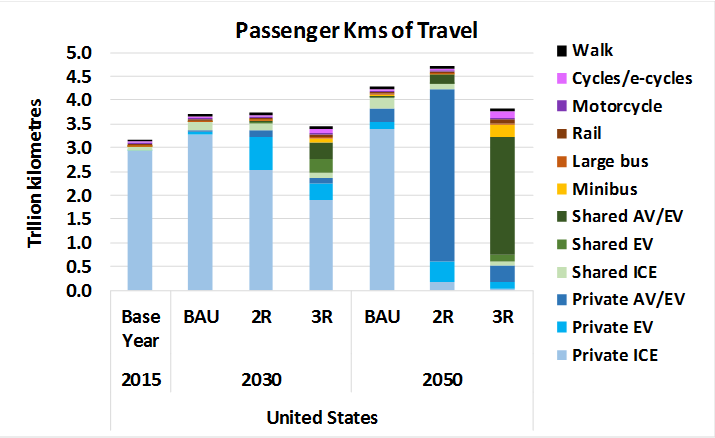
Three transportation revolutions are in sight, and together, they could help reduce traffic, improve safety, improve livability, and eventually save trillions of dollars each year and reduce urban transportation carbon dioxide emissions by 80 percent or more worldwide by 2050. Our new report from the Sustainable Transportation Energy Pathways (STEPS) program of ITS-Davis, done in cooperation with the Institute for Transportation & Development Policy and released May 3rd, tells us how.
The revolutions in question are electric vehicles, automated (driverless) cars, and shared mobility (multiple people sharing a trip, in the form of ride hailing or transit). All three of these revolutions are coming but it is not clear how fast, or which if any will dominate. But one thing is certain: to receive the most benefit from these revolutions, the most critical component is something most preschoolers know: Sharing is caring.
The report looks at how the revolutions may unfold out to 2030 and on to 2050 around the world, and delves into three urban travel scenarios surrounding the three transportation revolutions:
• Business as usual (BAU): a future without widespread electrification or automation
• “2 Revolutions:” electrification and automation are embraced but shared mobility is not
• “3 Revolutions:” electrification, automation and shared mobility are all widespread
Each revolution can provide important benefits. Electric vehicles have the potential to be near-zero CO2 emission, since they do not emit any emissions directly, and it is possible (and necessary) to decarbonize electric grids around the world over the coming decades. Automation may provide important safety benefits, particularly in the developing world where accident and injury/mortality rates today are often very high.
But the analysis and scenarios in this study find that it is shared mobility that provides the largest potential benefits, in the form of vastly reduced traffic, for starters. In fact widespread ride sharing could help move global transportation into a future that not only saves energy and emissions but also decongests highways, frees up parking spaces for other urban uses, cuts transportation costs, and improves walkability and livability.
It is important to emphasize that the use of “shared mobility” here does not include single-occupant ride-hailed Uber or Lyft vehicles, but only cases where multiple people share the ride. It also includes new forms of on-demand public transportation, such as small commuter buses with flexible routes. Active transportation, such as cycling, complements this scenario.
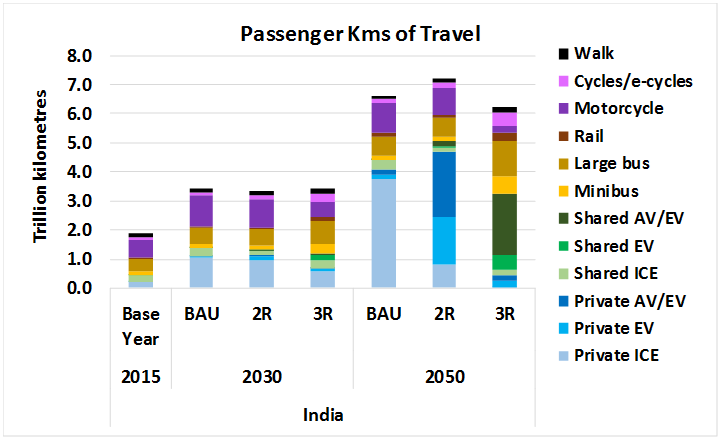
The report spans eight global regions, including five major markets: United States, Europe, China, India and Brazil.
The different global regions vary considerably in their starting points. For example, the United States is highly car-dependent, whereas India’s challenge will be to preserve and enhance shared mobility options they already have. Yet, across the globe, the 3 Revolutions, or 3R, scenario holds the most environmental and societal benefit.
As shown in the figures below, the greater range of modes (on a passenger kilometers basis) in India is clearly evident compared to the U.S., but in both cases the overall travel levels are lowest in the 3R scenario, with a far higher share of shared mobility (saving even more vehicle kilometers) than in the other scenarios.
Without a concurrent shift away from private vehicle ownership and toward ride sharing, the potential for electric, autonomous vehicles to reduce traffic and sprawl are severely limited, and CO2 reductions will be significantly less than with sharing.
Driverless vehicles alone could actually increase traffic congestion. Imagine people spending even more time in their cars or the possibility of zero-occupant, driverless vehicles continuously circling the streets rather than parking.
Electrification is also very important. We estimate that an autonomous vehicle world without electrification or trip sharing would not cut carbon dioxide emissions at all, and might actually increase them.
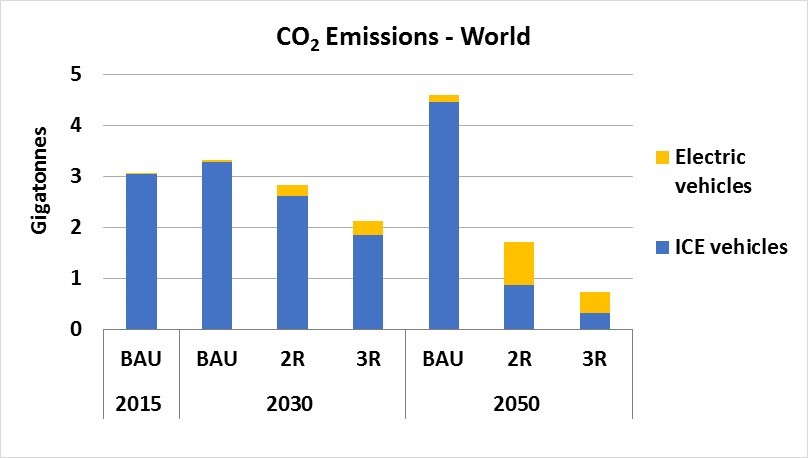
The report, “Three Revolutions in Urban Transportation,” comes the week before an international climate change meeting begins in Bonn, Germany. The climate talks will focus on implementing the 2015 Paris Agreement, which targets a 2 degree Celsius or lower cap to an overall temperature change from global warming. This target requires all nations to cut their carbon dioxide emissions dramatically by 2050. We note that the “3R” scenario would meet that benchmark for cities, and possibly go further. As shown in the figure below, the global urban passenger transportation CO2 emissions about 3 gigatonnes in 2015 rises to over 4.5 gigatonnes by 2050 in our BAU scenario, whereas it drops to below 2 in our 2R scenario (mainly due to electrification) and to below 1 gigatonne in 3R (due to much greater use of transit, non-motorized modes, and ridesharing in that scenario. It is also less dependent on decarbonized electricity to reach its 2050 level.
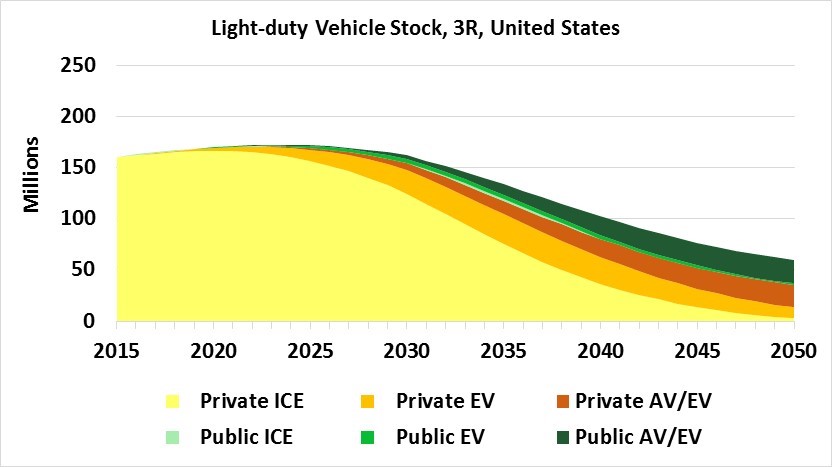
The effects of 3R on travel, and the numbers of light-duty vehicles, are shown in the figure below. Due to the much more intensive use of each commercial, shared vehicle, along with greater use of transit and non-motorized modes and a general reduction in trip lengths due to more compact cities, results in more than a 2/3 reduction in the stock of LDVs worldwide (and, as shown here, in the U.S.) in 2050 compared to the peak level in 2025 (and 75% below the peak reached in 2R). This opens up tremendous possibilities for re-tasking land use, such as for more bike lanes, more dense development (given fewer parking lots) and other changes to cityscapes.
Perhaps the most surprising result is that the 3R scenario costs far less to society by 2050 than the 2R scenario, with savings beginning around 2030 and increasing per year to reach over $5 trillion per year worldwide in 2050. This includes savings in fuel costs, the costs of new vehicle purchases (given dramatically lower sales and stocks of vehicles), and the costs of building and maintaining road and parking infrastructure. Even higher expenditures on better and more extensive transit systems do not offset the other savings very much.
We recognize that bringing about these revolutions won’t be easy. The report outlines needed policies, and says unprecedented levels of policy support and coordination are needed at the local, state and national levels.
The report assesses policies including those that incentivize widespread adoption of electric and driverless cars, as well as support for ride sharing, public and active transport, and land-use planning that helps shorten most vehicle trips. Such policies could consider fees tied to vehicle CO2 emissions, vehicle occupancy, and possible restrictions or heavy charges on private ownership of autonomous vehicles, along with strong disincentives for zero-occupant trips. Bicycle and e-bike sharing systems also need to be encouraged along with transit system innovations.
The report was funded by ClimateWorks Foundation, William and Flora Hewlett Foundation, and Barr Foundation.
I spent only two days in Marrakech for the 22nd annual United Nations Climate Change Conference – “COP22.” But it was enough to see that a) the commitment of countries and participants is still very high despite the results of the U.S. election, and b) the excitement of the Paris Agreement last year has given way to work “in the trenches” – the slow process of developing national CO2 targets and strategies to meet those targets, as per the commitments made under the agreement.
Thus a key theme of COP22 was debating how best to create a fair “rulebook” that all countries could share and have confidence in when assessing each other’s climate pledges. The technicalities of the rulebook—baselines, methodologies, etc.—will likely be a continuing discussion into 2018. This timeline means that few of the loose ends left by the Paris Agreement were completely tied up in Marrakech. But it was clear in the transportation meetings I attended that countries are now finally grappling with details:
• How do their overall “Nationally Determined Contribution” (NDC) targets compare to other countries’?
• How can they achieve these targets?
• Where does transportation fit in this big picture?
• What policies should they consider adopting for transportation and what types of impacts will specific policies have?
In fact, as detailed in a very useful 2016 report by the Partnership on Sustainable Low-carbon Transport (SLoCaT), while 75% of the 138 existing NDCs developed before the COP specifically mention transport as an important sector for reductions, only 63% include any specific transportation mitigation measures, and only 9% have developed a transportation-specific target for CO2 reductions. A major point of discussion on November 13th the “Transport Day” workshop in Marrakech was this: What levels and types of targets should countries be considering for their transportation sectors?
In considering this, the following figure is instructive. Based in part on International Energy Agency (IEA) scenarios and in part on countries’ own plans to date, it shows the stark difference between a “business-as-usual” (BAU) scenario and “low-carbon scenarios” for transportation worldwide. The low-carbon scenario is based on reviewing a wide range of studies on what appears feasible given a fairly strong mix of measures; this is roughly aligned with a transportation trajectory consistent with the IEA 2 degree scenario, where 2050 emissions are about 20% below 2010 levels.
However there was much discussion at this COP about achieving a 1.5-degree target, given the strong call for this in the Paris Agreement. This is (perhaps surprisingly) estimated to be much more challenging than achieving 2 degrees since a) the full economy-wide carbon budget must be much lower and- related CO2 emissions should actually hit net zero before 2050, and b) since transport does not decarbonize that deeply under a 2 –degree target it is left with a large additional “workload” under a 1.5-degree target, to achieve near zero emissions by 2050. (It does not quite reach zero on the assumption that other sectors, notably electricity generation, manage to go below zero such as through a combination of bioenergy and carbon capture and storage strategies.)
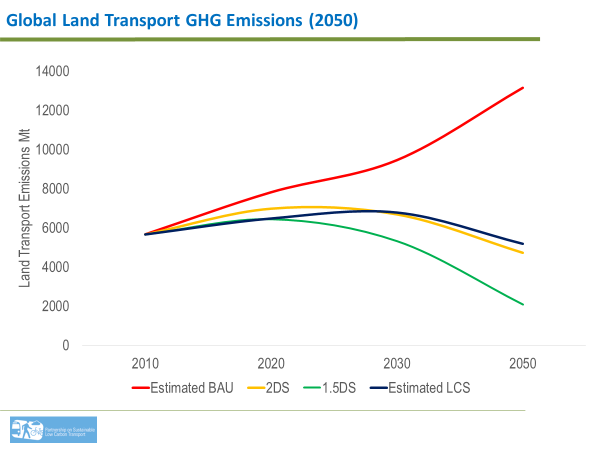
Source: SLoCaT, 2016
To achieve such a 1.5 degree target, countries will literally have to “throw the kitchen sink” at the problem, with strong national and sub-national commitments in all aspects of transportation including “avoid”, “shift” and “improve” options. Very strong land use planning efforts, major investments in public transit systems, walking and cycling infrastructure, strong pricing mechanisms, and a major push toward greener vehicles (via fuel economy improvements and a transition to very low-carbon energy systems) were all discussed as needing to be part of the answer. Previous debates about “technology vs. behavior” have given way to “we have to do it all” discussions. For urban transportation, the idea of a 50-50 strategy between “avoid/shift” and “improve” strategies seemed to take hold. Air and shipping were also discussed and there was a consensus that these modes may be even more difficult to decarbonize than land transportation, given the limited options and lack of electrification potential.
Meanwhile, a separate meeting of transportation modelers, ITEM-2 (the “International Transportation Energy Modeling” group, founded by Sonia Yeh and myself) was held two weeks prior to the COP in Chalmers, Sweden. This meeting included 12 major models and modeling groups, and undertook a range of comparisons of BAU and low-carbon scenarios. Basically none of the models has developed a transportation pathway approaching the 1.5-degree scenario in the above figure, and even 2-degree transportation scenarios are clearly a challenge for these models. A compilation of scenarios from the meeting is shown the figure below.
Selected ITEM-2 BAU/transitional (black) and low-carbon (green) scenarios
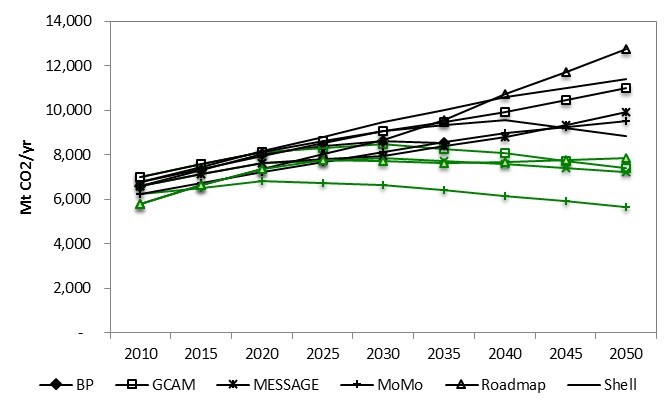
Source: ITEM conference, Chalmers Sweden, 25-26 October, 2016
But at that meeting there was an agreement to continue to develop stronger, more ambitious scenarios, and this was reiterated when the results of this workshop were presented during Transport Day at the COP. It was generally agreed that this modeling group, that includes universities such as UC Davis, international organizations such as IEA, ITF and IIASA, and energy companies such as Shell and BP, can serve as an important “sounding board” for the COP system and individual countries going forward as they develop their own strategies and attempt to estimate the potential CO2 reductions that they can achieve.
In the end, this COP, at least for transportation, has launched a new era of practicalities – developing detailed plans and strategies, along with quantitative assessment tools to score these as well as track progress.
The STEPS program at ITS-Davis will stay closely involved as this process moves forward, offering to provide important analysis that can help underpin the global approach underway to decarbonizing transportation.
Lew Fulton is the co-director of the Sustainable Transportation Energy Pathways (STEPS) program at the UC Davis Institute of Transportation Studies.
By: Miguel Jaller and Lew Fulton
When the state earlier this month released for public comment its draft California Sustainable Freight Action Plan (CSFAP), we were excited to see the fruits of our labors here at ITS-Davis contributing to this comprehensive and forward-thinking draft plan.
CSFAP is an ambitious document that lays a foundation for modernizing California’s multi-billion dollar freight transportation system. Seven state agencies worked together to develop the draft in response to Governor Brown´s Executive Order B-32-15 last July, which directed the state agencies to pursue a shared vision to “improve freight efficiency, transition to zero-emission technologies and increase the competitiveness of California’s freight system.” The public comment period on the draft CSFAP is open until July 6.
Our role in the development of this plan has been to advise and convene, and to provide technical analysis and input. Just after the release of the governor’s executive order, ITS-Davis and the National Center for Sustainable Transportation convened stakeholders from academia, industry and government to discuss and identify strategies to inform the CSFAP. This working group of experts, the Freight Efficiency Strategies Development Group, met over the last eight months and produced a set of six white papers that are included in the CSFAP materials. Rather than make specific recommendations, the white papers discuss a range of strategies that could be used, granted further analyses, to accomplish some of the state’s goals for efficiency, safety, economic competitiveness, environmental and social justice, and introduction of new technologies.
Our UC Davis team led the development of two of the white papers, “Strategies to Maximize Asset Utilization in the California Freight System Part 1 and Part 2.” We highlight the importance of looking at the freight system as a whole and complex system of systems, where strategies aimed at specific stakeholders could have cascading, positive or negative, effects over others. Therefore, designing policies or strategies that consider behavioral shifts and efficiency improvements requires identifying the appropriate decision makers, which could range from large private organizations, planning agencies, or even industry sectors to households and individuals requesting residential deliveries. More importantly, the papers recognize that continuous improvements and investments are being made in the system, though in a silo manner, which do not guarantee reaching system-level efficiency improvements. That is, some efficiency gains by specific stakeholders could be done at the expense of the inefficiency of others.
To reinforce the state’s efforts, last October we launched our own Sustainable Freight Initiative here at ITS-Davis. It has two main interdependent thrusts: sustainable freight systems, and technology and fuel analysis. Our critical research dovetails nicely with the findings of CSFAP. For example, we are studying:
Moreover, for the first time, we’ve offered an academic course on sustainable freight transportation; we hope it’s the first of many on this important topic.
In the coming years, we expect to contribute more research and knowledge, and support workforce development and stakeholder engagement to achieve the state’s targets of system efficiency, a transition to zero emission technology, and economic growth. Since we are a key contributor to the Freight Efficiency Strategies Development Working Group and are already part of the draft plan, we will continue working with the agencies to identify and refine the scope of additional strategies, and help with deployment activities.
The CSFAP has been called “innovative” and potentially “transformative.” But it’s clear that a combination of strong improvements in freight systems as well as technology and fuel solutions will be required to meet the state’s emissions and sustainable freight goals. ITS-Davis looks forward to being part of the effort to identify and develop the most promising solutions.

By: Lew Fulton
The Paris Climate Accord reached on Saturday, December 12, feels like a home run. Nearly 200 countries fully agreed on text in which they pledge to make large reductions in greenhouse gas emissions over the next 15 years, with mechanisms to help ensure that this goal is achieved. It includes quantified CO2 mitigation commitments from all major economies around the world; mechanisms for reporting and verifying progress; commitments for $100 billion in financing of actions; and many other key elements.
![]() However, as President Obama said in his speech that day, this agreement does not “solve” the global climate change problem.
However, as President Obama said in his speech that day, this agreement does not “solve” the global climate change problem.
“Even if all the initial targets set in Paris are met, we’ll only be part of the way there when it comes to reducing carbon from the atmosphere, so we cannot be complacent.”
The president is correct: This is only a partial solution that does not (yet) limit temperature change to 2 degrees Celsius, and it needs to be fully implemented over the coming years, with all the uncertainties around that. But it does contain many promising elements. For example, it includes specific pledges from most of the signatories to cut CO2 emissions by 2030. These commitments vary widely, as do each country’s circumstances.
What’s the outlook for transportation? Last week I noted some of the measures that feature in the Intended Nationally Determined Contributions (INDCs) of a range of countries. Today I’ll show a comparison of actual targets under the accord, with one possible scenario for transport. This is highly speculative since few countries have indicated the sectoral breakdowns of their targets; for example, even countries shooting for 40% reductions in CO2 emissions have not indicated if that means 40% in each sector (transport, buildings, industry, electricity generation, etc.) or 40% on average with individual sectors varying. But if you take for a moment the possibility that transportation delivers reductions at an average intensity, you can gain a sense of the challenge ahead.
The first figure below shows the 2014 estimated energy-related CO2 emissions for six major economies, and the 2030 target (taken as the midpoint in cases where a range of targets is possible, based on analysis presented here). The second figure shows hypothetical targets if transportation CO2 were reduced in the same proportion as the overall targets for each country, starting from 2014 transportation CO2 emissions as estimated by the International Energy Agency.
As you can see in the first figure, the U.S. commitment is ambitious – a major reduction from nearly 20 tons per capita to less than 13 by 2030. As shown in the second figure, if the U.S. reduced transportation-related CO2 emissions in proportion to this total, it would be a cut from about 6.5 tons per capita to about 4.5 by 2030.
This would still leave the U.S. at a higher per-capita emissions level than any of the other countries or regions shown. But it certainly would put the U.S. on a strong downward trajectory. China and India would actually increase their per-capita transportation emissions, but not by as much as would have occurred without their commitments – and both would remain at a very low CO2 level in 2030. Russia would retain a more average position; though Russia is noticeable in its overall target (Figure 1) in that it starts with fairly high emissions and these increase significantly – it would become the highest per capita of the six countries by 2030.
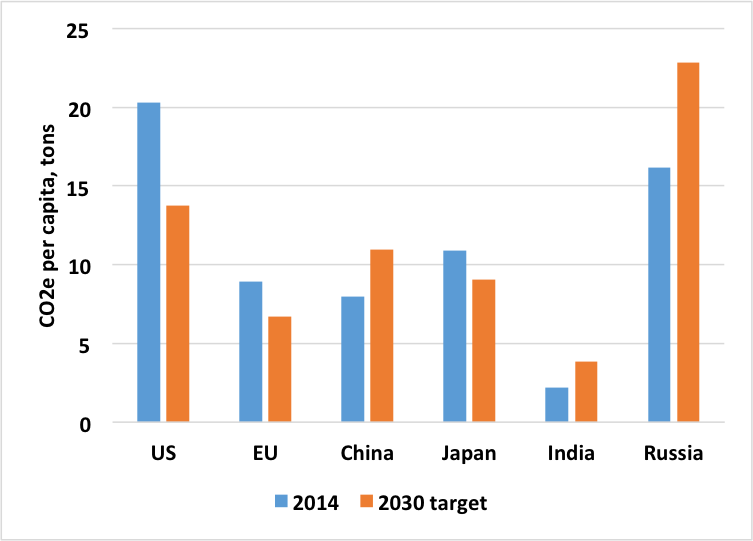
Figure 1. All energy-related CO2 emissions per capita for selected countries, for 2014 and explicit or implied targets for 2030 (based on analysis conducted by climateactiontracker.org, using national INDC reports; for 2030 approximate midpoints are used where a range of targets or uncertainty in targets may exist; these are meant to be indicative and are not official numbers).
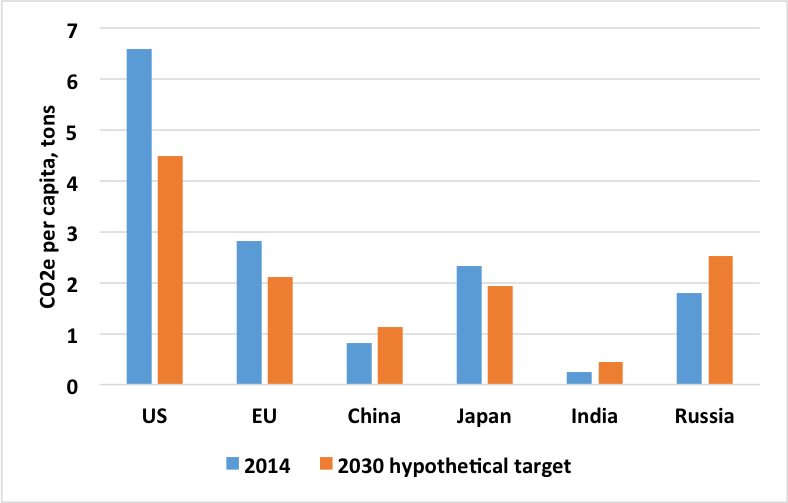
Figure 2. Transportation-related CO2 emissions per capita for selected countries, for 2014 and hypothetical targets for 2030 (based on the analysis conducted by climateactiontracker.org, and adjusting the national commitments in Figure 1 for transportation, assuming transportation reductions are taken in the same proportion. Transportation CO2 estimates for 2014 are taken from the IEA Mobility Model).
Whether or not countries decide to tackle transportation at the same level of intensity as other sectors, they will need to include ambitious goals for transportation to succeed. How will they achieve targets like these and move from planning to doing?
“You have to do many different things and each place it’s different,” noted California Governor Jerry Brown in Paris.
Among the combinations of measures that make sense for most countries to include: promote much better fuel economy of new cars and trucks (and also of second-hand imports, for those countries that import many such vehicles); shifts of travel from high CO2 modes (like cars and trucks) to lower CO2 modes (mass transit, cycling and walking, along with more rail freight). Alternative fuels will also need to play an expanding role. The only three potentially very low-emission fuels are electricity, hydrogen and biofuels, and these will need to lead the way to very low CO2 emissions. International aviation and shipping are particular challenges, since they are not covered under individual country commitments. The international bodies International Civil Aviation Organization (ICAO) and International Maritime Organization (IMO) have been asked to redouble their efforts to work with industry on commitments and strategies for these sectors, and they too will need to put a large emphasis on efficiency and alternative fuels.
The best combination of measures will vary by country, as will the role of transportation in achieving overall CO2 targets. During 2016, the STEPS program at UC Davis will be looking more closely at the plans of different countries and assessing combinations of transportation measures that can help get the job done.
All told, the U.N. Framework Convention on Climate Change Conference of the Parties (COP21) in Paris was the subject of exhaustive negotiations (and a 31-page agreement); extensive coverage in traditional media; and enormous attention on social media.
What’s yet to be written is whether the conference ultimately achieves its lofty goal: ensuring a “shared future and shared environment” for our planet.